Solana (SOL) Drops Below $170 as Technical Indicators Signal Weakness
Solana faces bearish signals as institutional interest grows; EMA death cross and Ichimoku Cloud hint at short-term downside risk.
- Solana trades under $180 for six days despite rising institutional accumulation and 65% of supply now staked.
- Ichimoku Cloud and BBTrend indicators flash short-term weakness, pointing to consolidation and low momentum.
- A looming EMA death cross could push SOL down to $141 if $160 support fails, though a breakout above $176.77 offers upside.

Solana (SOL) is down 5% over the past seven days and has traded below $180 for six consecutive days. Despite this, institutional interest in SOL is rising, with large players accumulating and staking significant amounts ahead of a potential altcoin season.
However, technical indicators are showing signs of weakness, including a negative BBTrend, a bearish Ichimoku Cloud setup, and a looming EMA death cross. These mixed signals suggest that while long-term confidence is growing, short-term momentum remains under pressure.
Solana Draws Institutional Interest, But Ichimoku Cloud Signals Uncertainty
Institutional accumulation of Solana is intensifying in May 2025, signaling strong confidence ahead of a potential altcoin season.
Despite altcoin trading volumes remaining below previous peak levels, major players have been stacking SOL—staking large amounts and adding to long-term holdings.
Over 65% of SOL’s supply is now staked, and Q1 2025 app revenue reached $1.2 billion, the strongest in a year. These trends, combined with positive on-chain flows and ecosystem expansion, position Solana as a frontrunner if altcoin momentum returns.
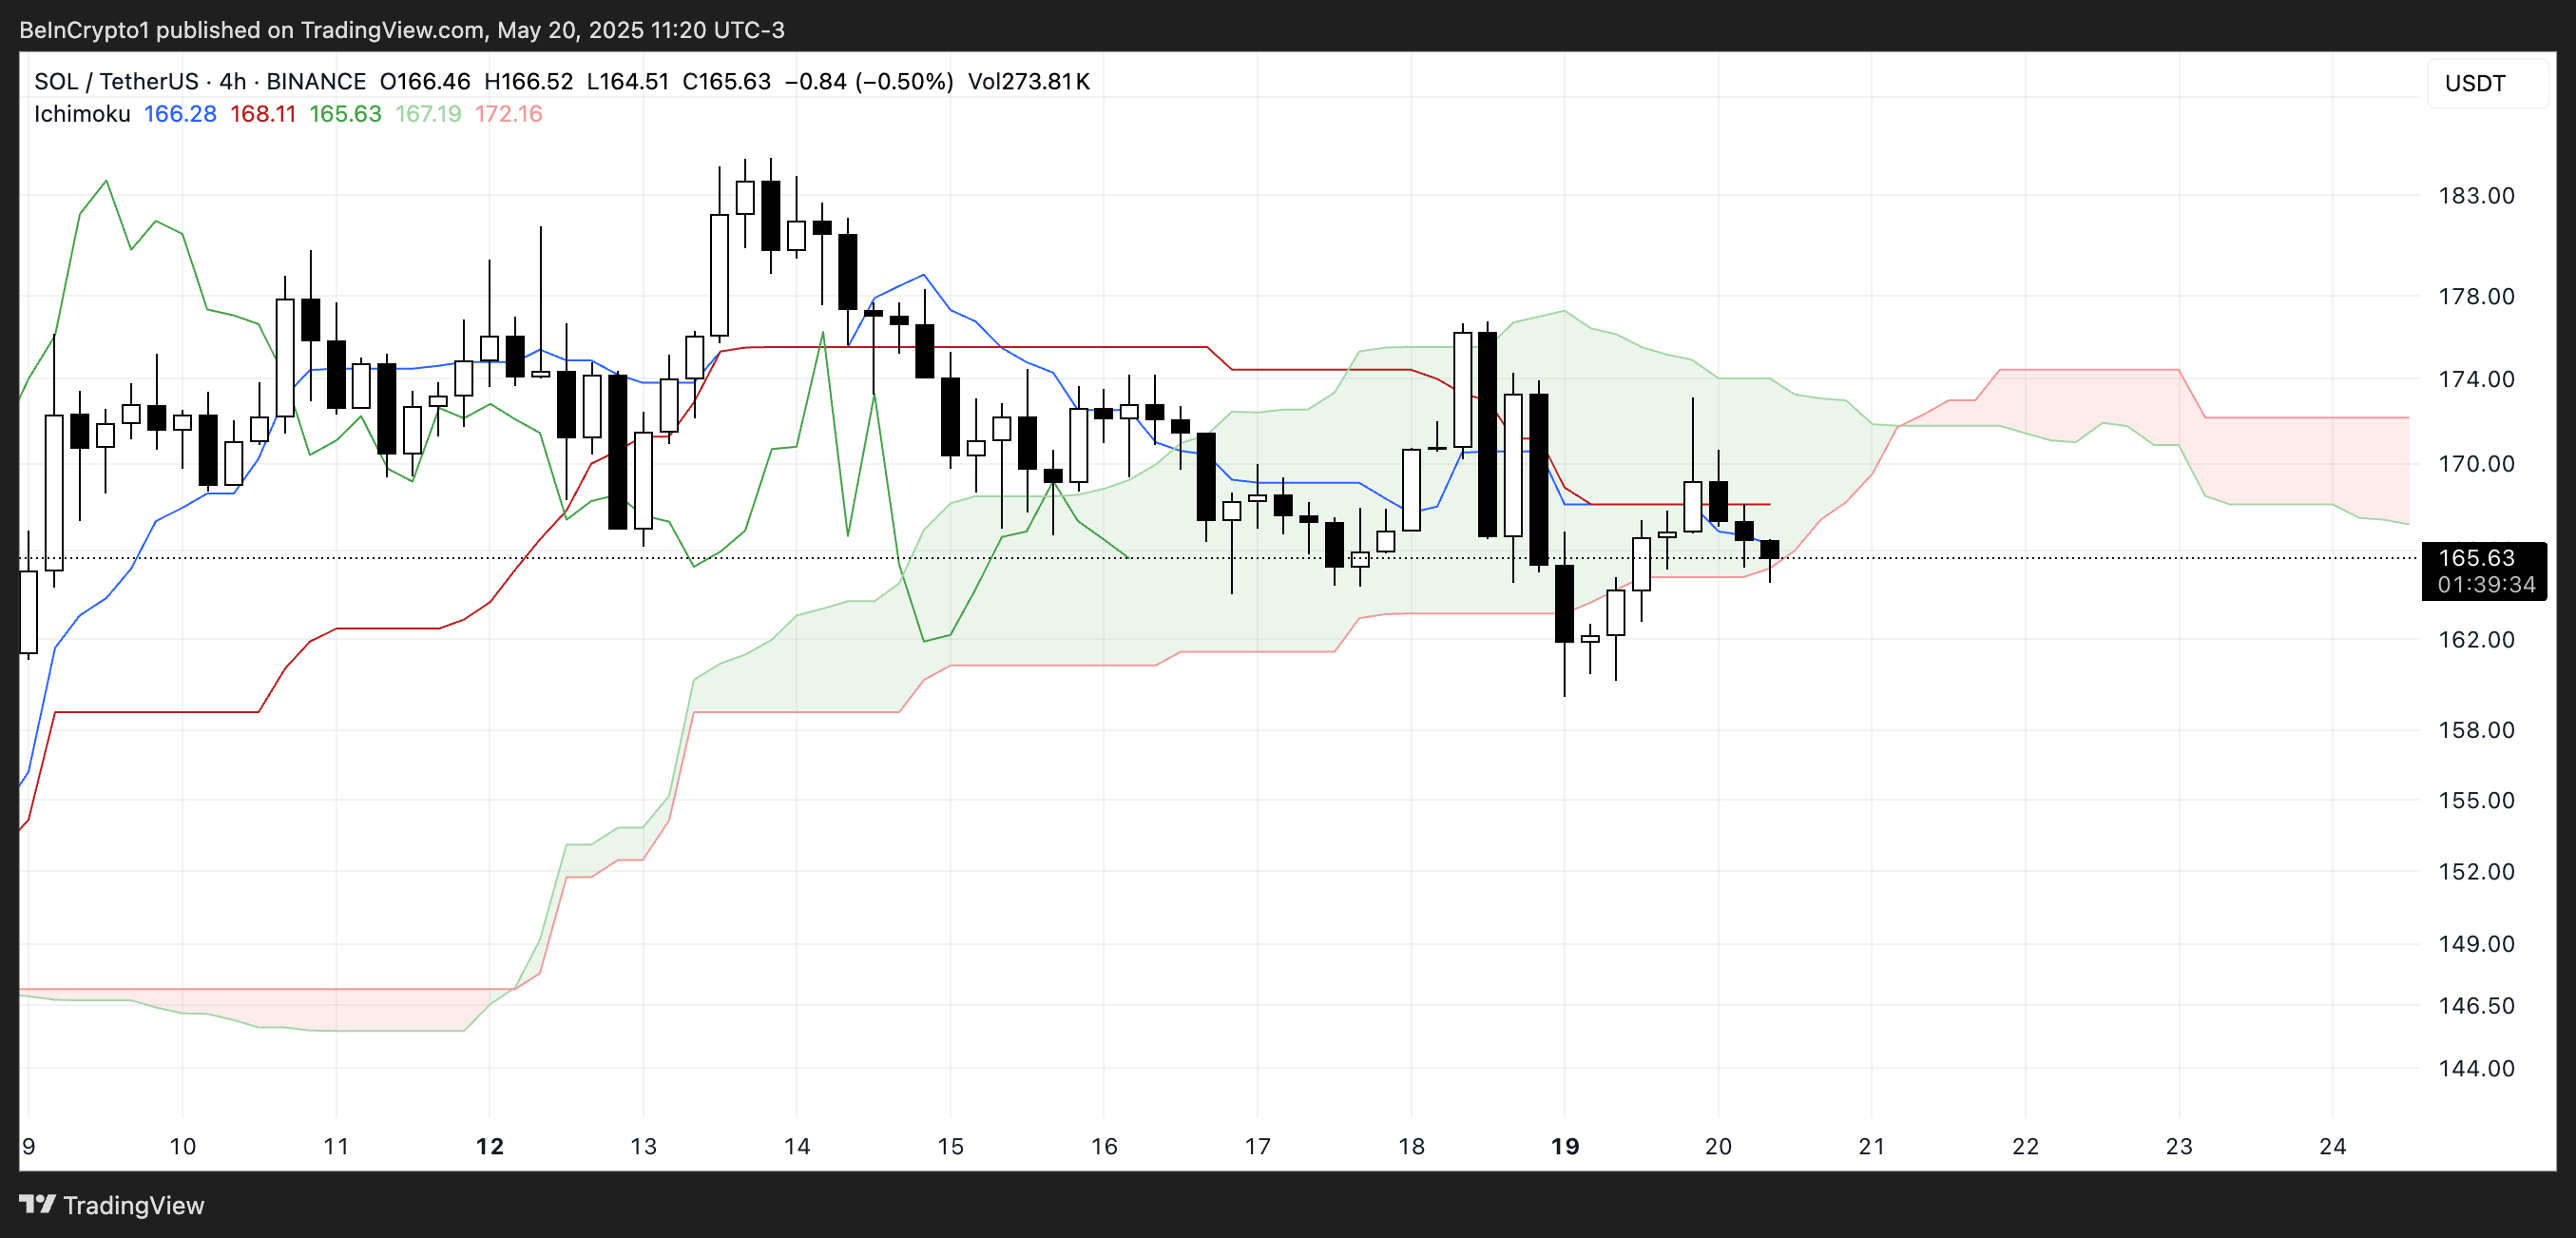
The Ichimoku Cloud chart for Solana currently reflects market indecision with a slight bearish tilt. Price action is hovering inside the green cloud, suggesting consolidation and a lack of clear direction.
The blue Tenkan-sen (conversion line) sits below the red Kijun-sen (baseline), indicating short-term weakness. The Chikou Span (green lagging line) is tangled in recent price action, reinforcing the neutral-to-bearish bias.
Ahead, the cloud shifts to red and appears flat, pointing to potential resistance and low momentum unless a strong breakout occurs.
SOL BBTrend Stays Negative, Bearish Momentum Holds Below -4
Solana’s BBTrend is currently at -4.31, marking its third consecutive day in negative territory.
Over the past several hours, the indicator has remained stable around -4, suggesting consistent bearish pressure in the short term.
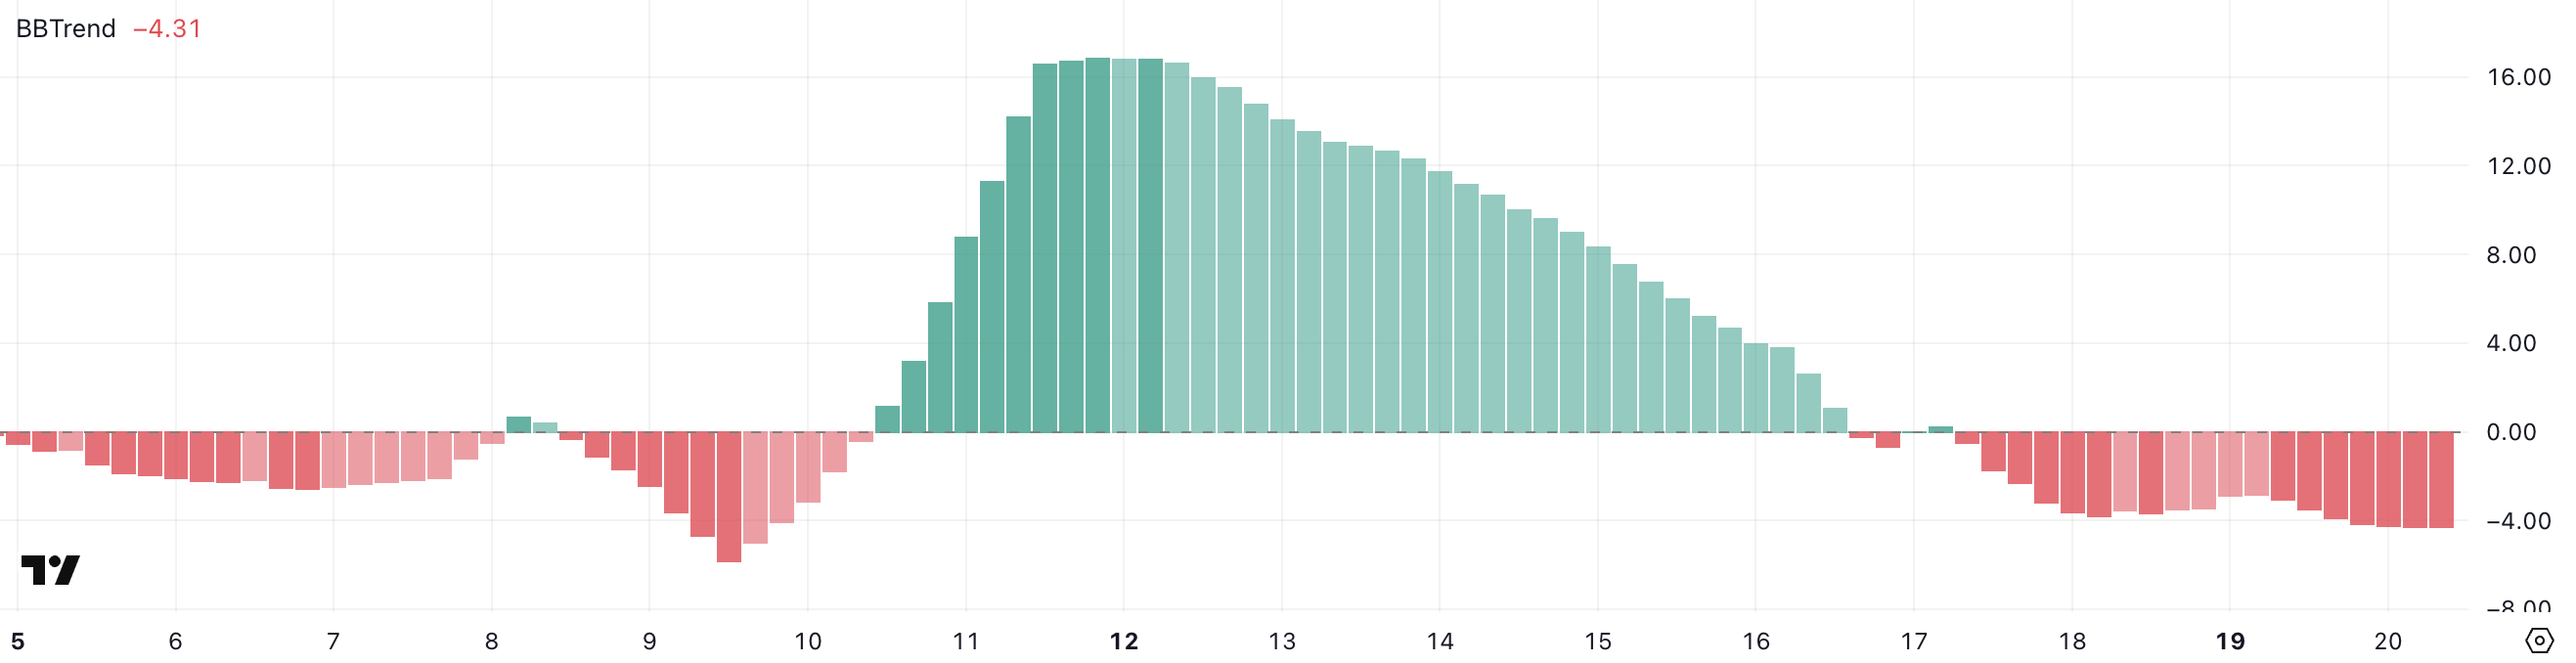
The BBTrend (Bollinger Band Trend) measures the strength and direction of price movement relative to the width of the Bollinger Bands.
Values above 0 typically indicate bullish momentum, while values below 0 signal bearish momentum. A BBTrend at -4.31 reflects strong downward pressure and limited volatility expansion to the upside.
If this trend continues, it may point to further consolidation or even a deeper pullback unless a sharp reversal breaks the pattern.
Death Cross Setup Could Push SOL Back To $141 If $160 Support Fails
Solana’s EMA lines are converging and could soon form a death cross, a bearish technical signal where the short-term EMA crosses below the long-term EMA. If that occurs, SOL price could test the support level at $160.
A breakdown below this level could push the price down to $153.99, and if bearish momentum accelerates, Solana may decline further toward $141.
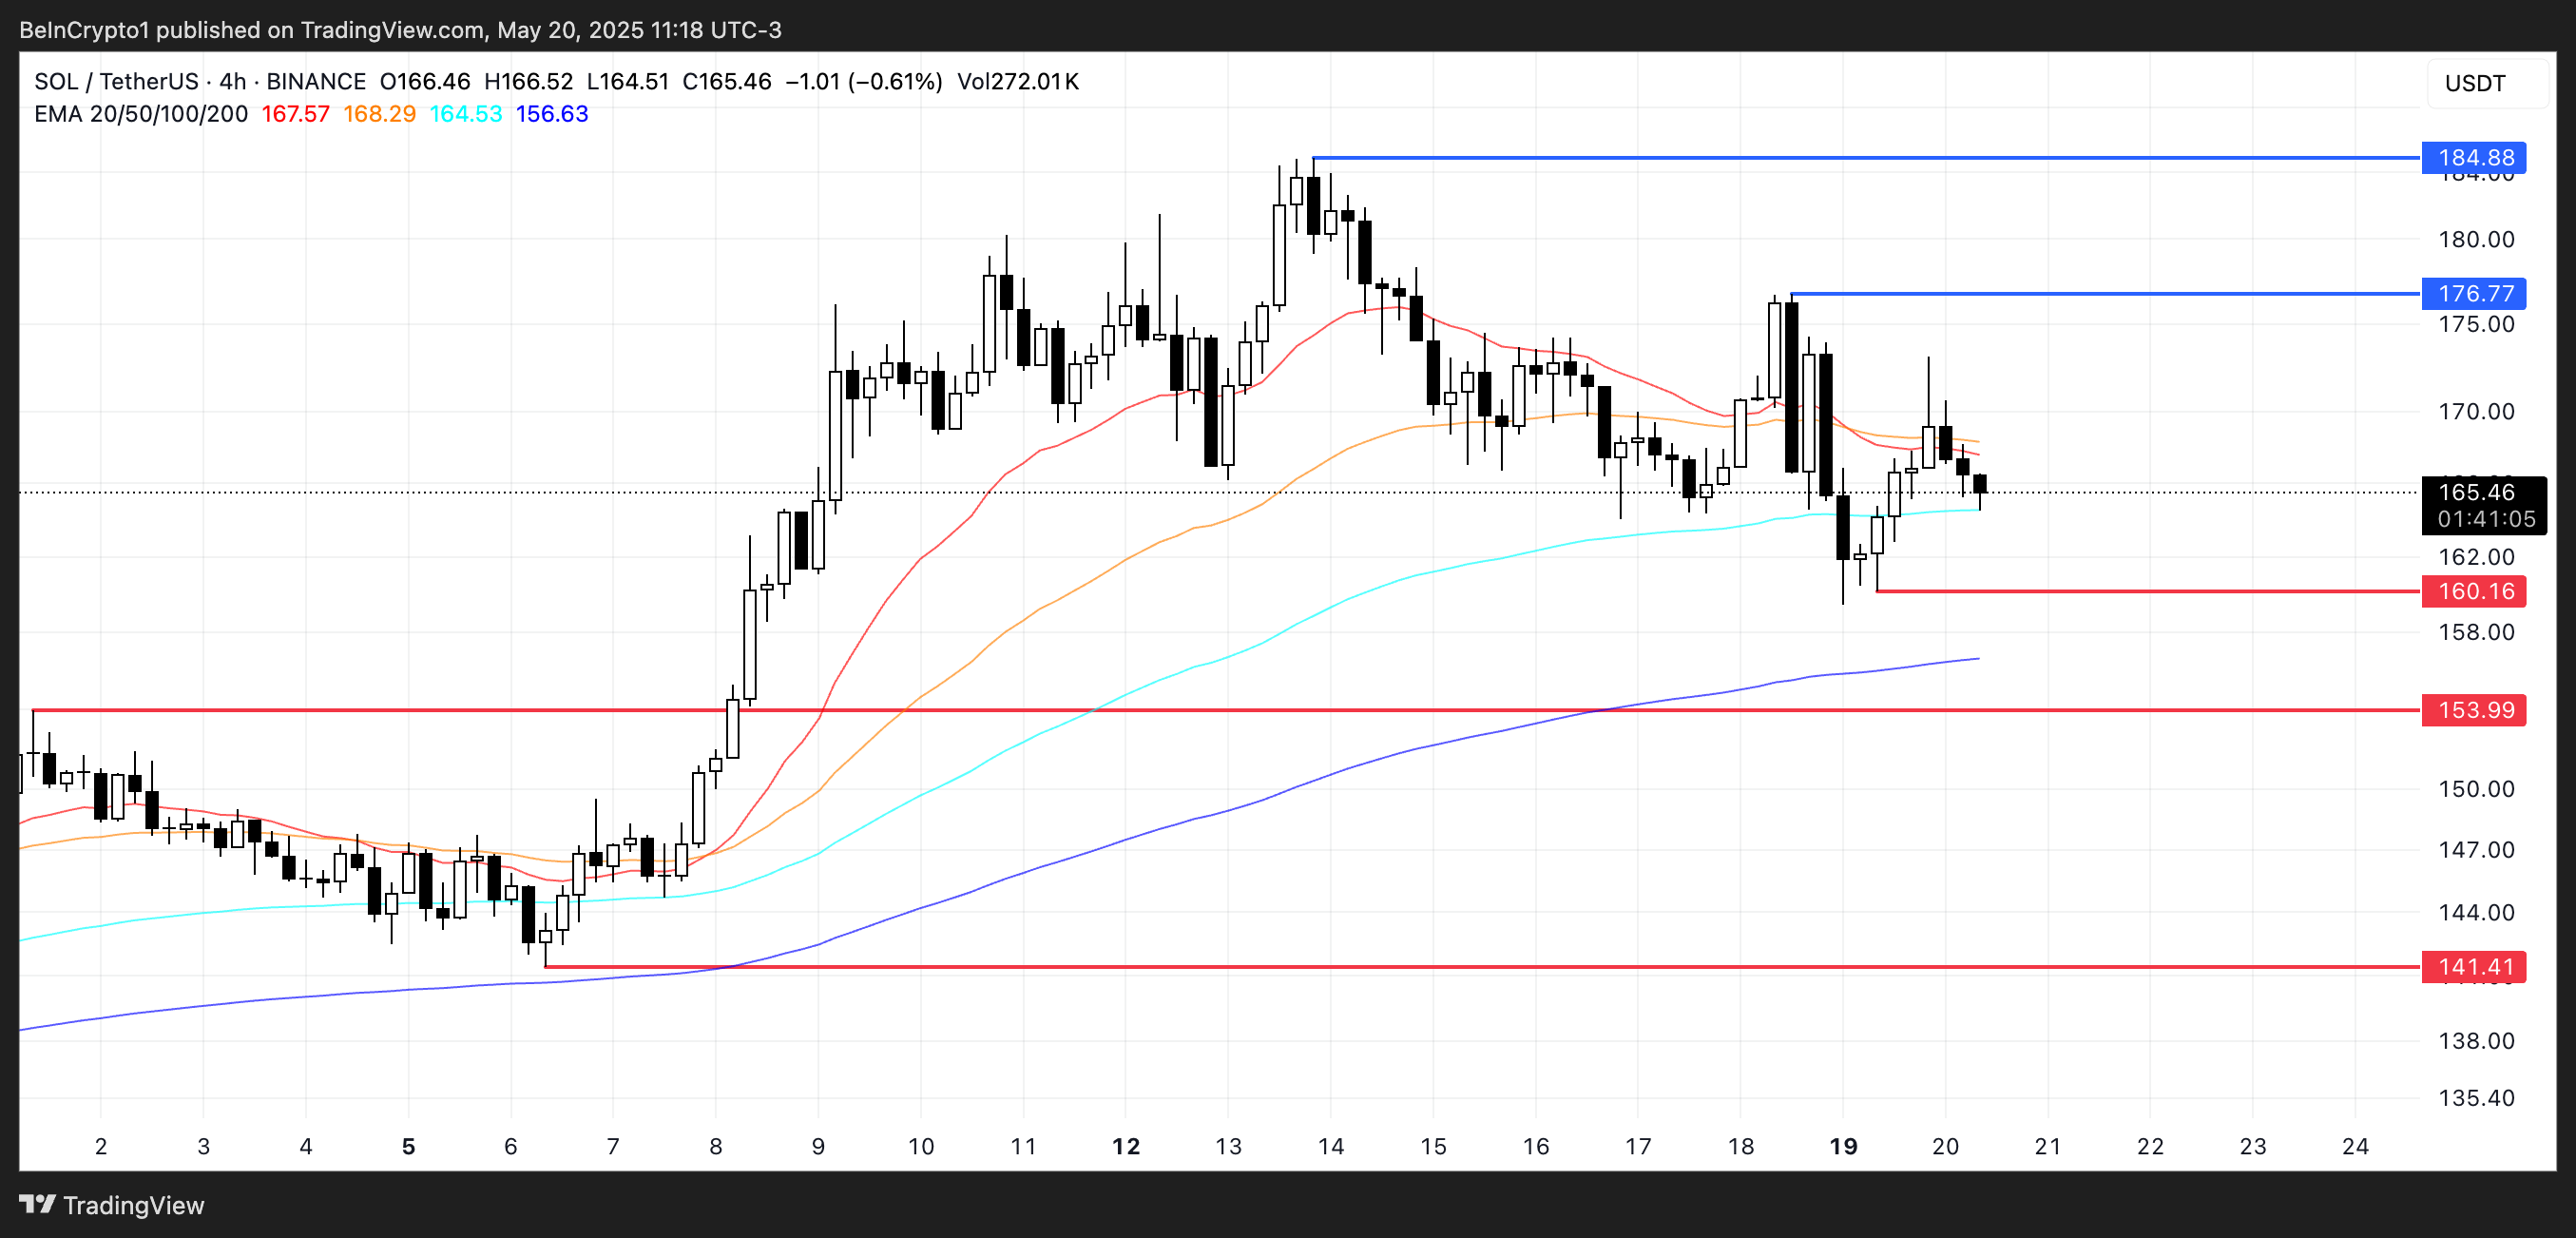
On the other hand, if Solana regains bullish momentum, the first resistance to watch is at $176.77.
A successful breakout above this level could open the door for a further rally toward the $184.88 zone.
Disclaimer: The views in this article are from the original Creator and do not represent the views or position of Hawk Insight. The content of the article is for reference, communication and learning only, and does not constitute investment advice. If it involves copyright issues, please contact us for deletion.


