USDCAD moves above 100 hour MA. Can the price stay above the MA and give the buyers hope
USDCAD fell during yesterday’s Asia-Pacific session, breaking below a key swing area between 1.38078 and 1.38499 . The initial decline reached a low of 1.
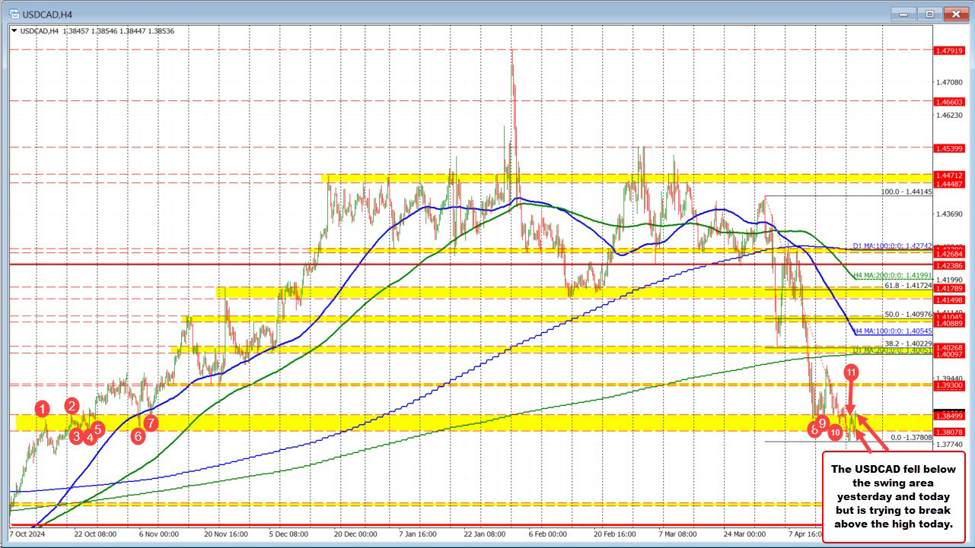
USDCAD fell during yesterday’s Asia-Pacific session, breaking below a key swing area between 1.38078 and 1.38499. The initial decline reached a low of 1.37808 before rebounding to a session high of 1.3845, near the upper boundary of the previously mentioned swing zone, which dates back to October and November 2024.
The price subsequently rotated lower, breaking below the swing area again and reaching a new low of 1.37922 in today’s early trading. However, during the European session, USDCAD rebounded sharply, climbing back above the swing area high at 1.38499 and extending to a new intraday high of 1.38609.
Importantly, that move also pushed the pair above the 100-hour moving average, currently at 1.38463 (see blue line on the chart). This level has been a persistent ceiling, with failed break attempts seen on Tuesday, Wednesday, and Thursday—each occurring at successively lower levels. Today’s break represents another attempt by buyers to shift the bias.
For buyers to gain more control, they must first maintain price action above the 100-hour moving average, and then target the falling 200-hour moving average at 1.38828. Notably, the price has not traded above that level since a brief push on April 9, and before that on April 7. A sustained move above both moving averages would strengthen the bullish case and tilt short-term technical momentum further in favor of buyers.
Disclaimer: The views in this article are from the original Creator and do not represent the views or position of Hawk Insight. The content of the article is for reference, communication and learning only, and does not constitute investment advice. If it involves copyright issues, please contact us for deletion.


