XCN Tumbles 15% While Bearish Indicators Point to More Downside
XCN dip of 15% signals continued downturn as bearish indicators suggest further losses in the altcoin market.
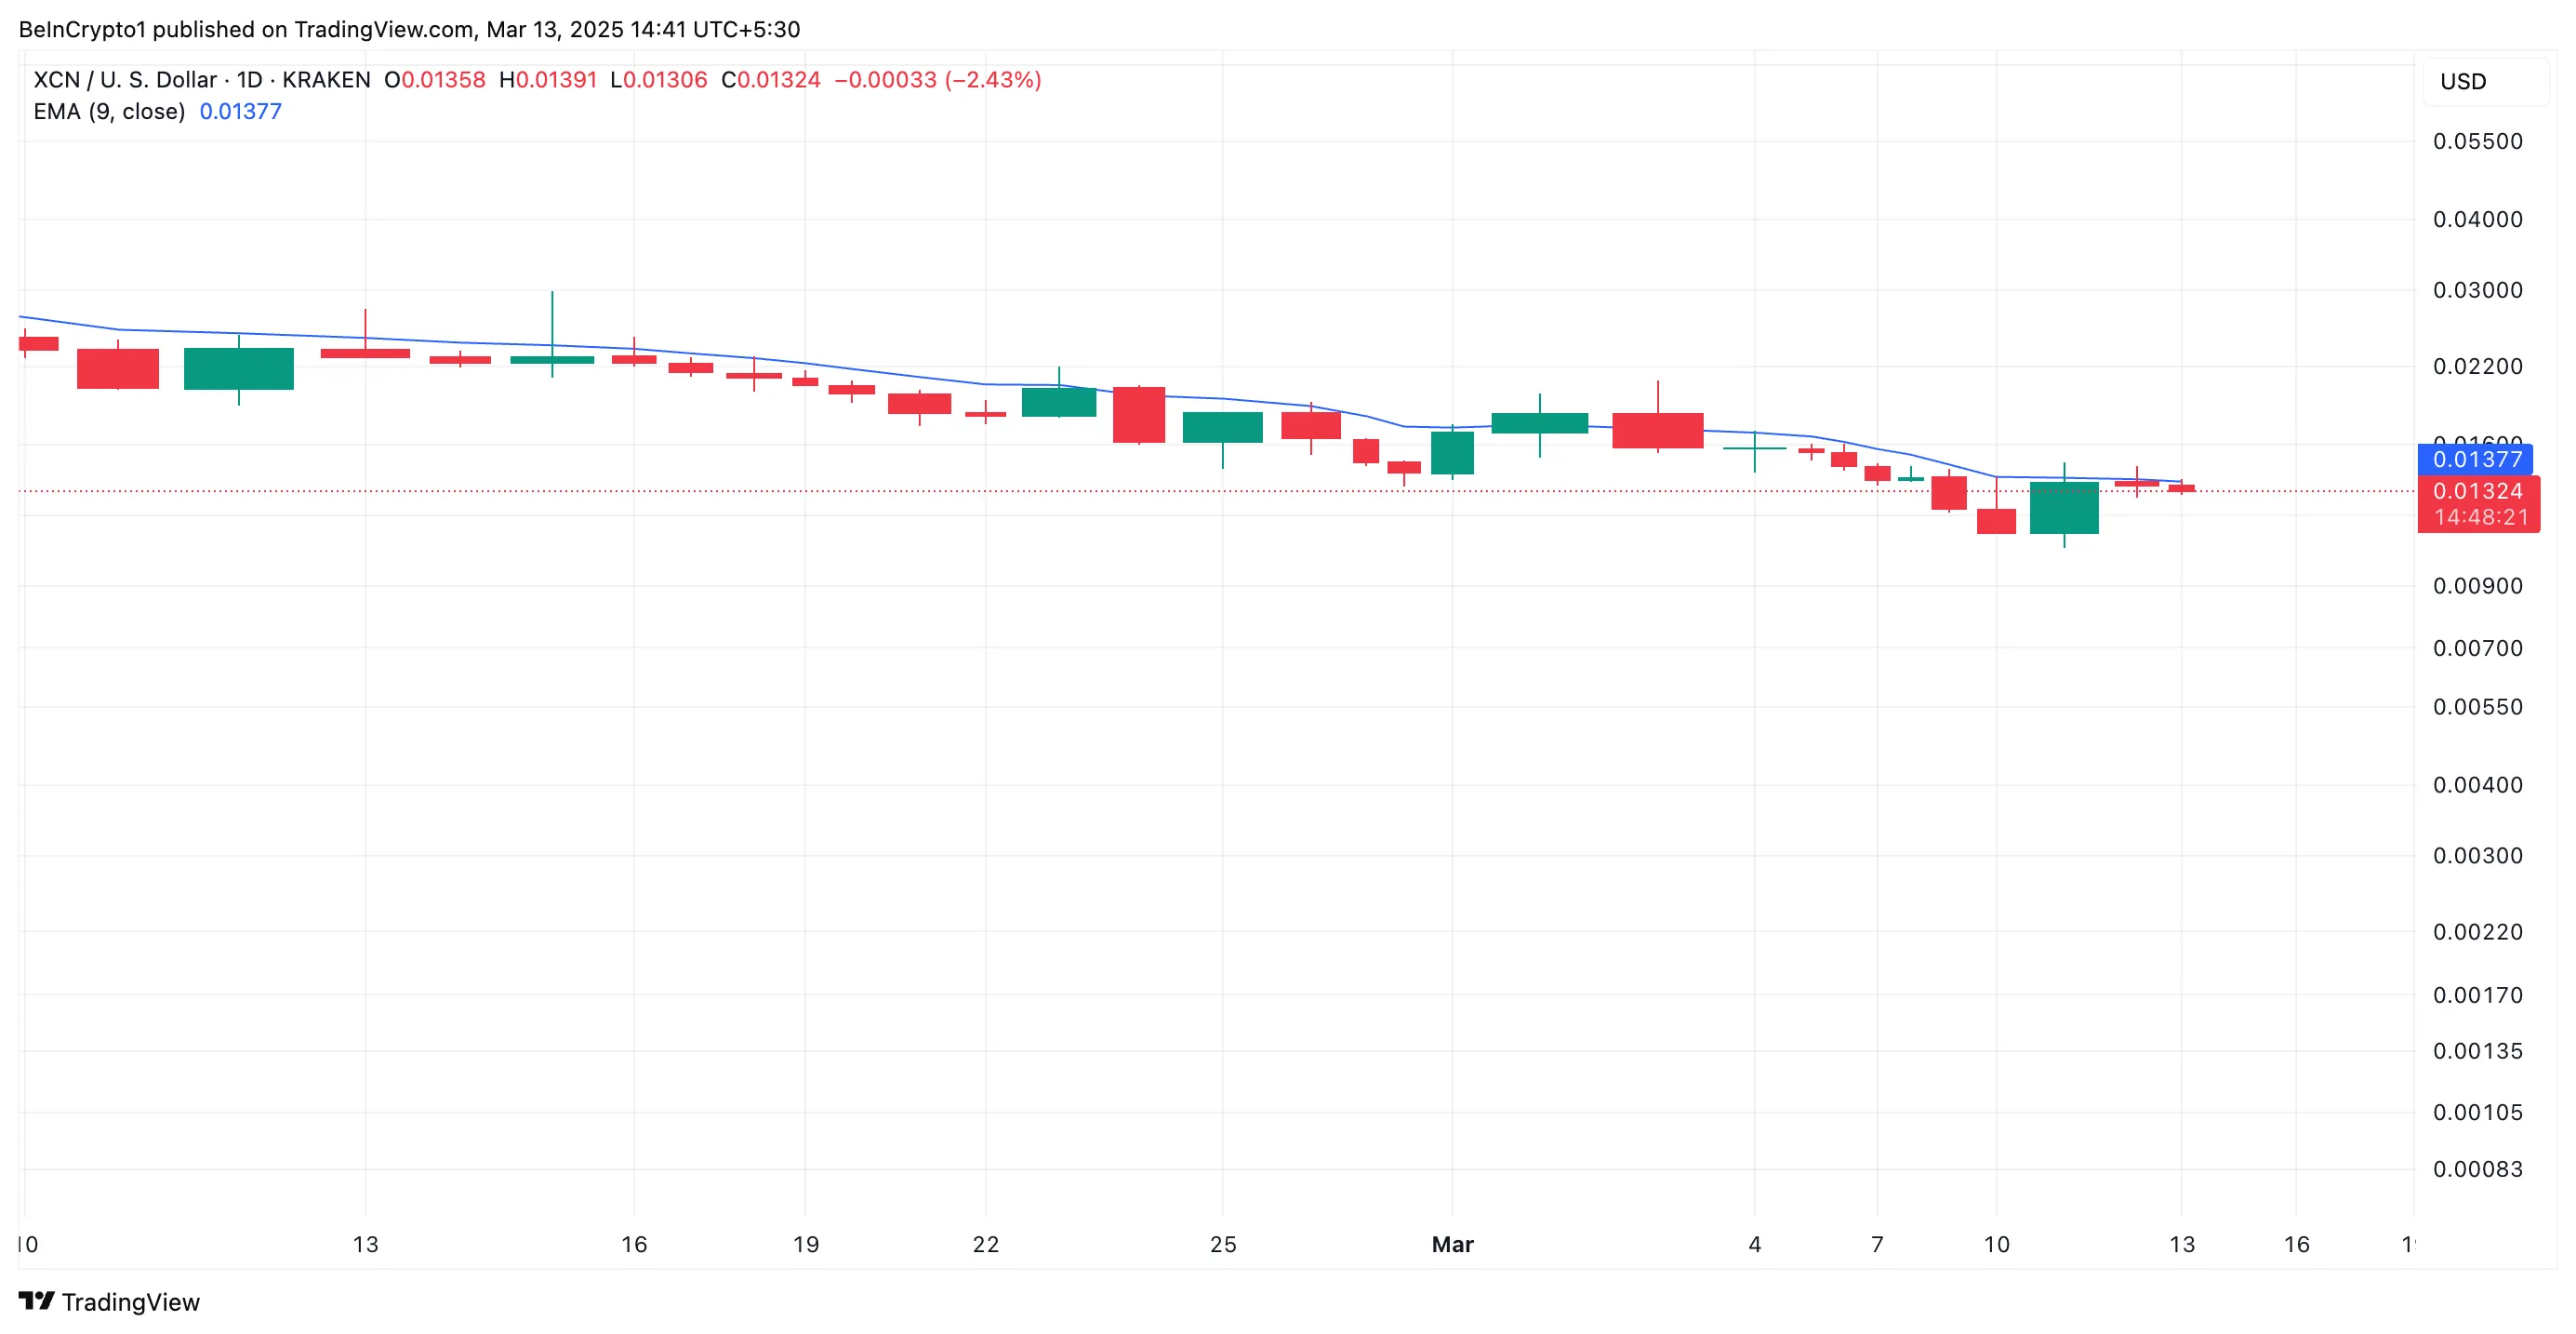
- XCN drops 15% over the past week, trading at $0.0132 amid broader market volatility.
- Bearish indicators show XCN trading below key levels, signaling continued downward momentum.
- Price could drop further to $0.0117 unless buying pressure pushes past resistance at $0.0137.

Onyxcoin has taken a significant hit, plunging 15% over the past week amid broader market volatility. At press time, the altcoin exchanges hands at $0.0132, noting a 1% price dip amid the general market rally.
While other assets attempt to recover, XCN remains trapped in a strong bearish cycle, with technical indicators pointing to the possibility of further losses.
XCN Bears Dominate as Price Trades Under Major Resistance Zones
Readings from the XCN/USD one-day chart show the altcoin trading below its 20-day exponential moving average (EMA). This forms resistance above its price at $0.0137.
The 20-day EMA measures an asset’s average trading price over the past 20 days, giving more weight to recent prices for a smoother trend analysis.
When the price falls below this key moving average, it signals weakening momentum and a downtrend as sellers gain control. This indicates that XCN could face further losses unless strong buying pressure reverses the decline.
Furthermore, the altcoin trades significantly below the Leading Spans A and B of its Ichimoku Cloud, supporting this bearish outlook.

This indicator measures the momentum of an asset’s market trends and identifies potential support/resistance levels. When the price falls below this cloud, the asset in question is witnessing a downtrend. In this scenario, the cloud also acts as a dynamic resistance zone, reinforcing the downtrend.
For XCN, its Ichimoku Cloud forms dynamic resistance above its price at $0.0154 and $0.0300, highlighting the strong downward pressure on the coin’s price.
XCN Bears in Control – Breakout or Breakdown Next?
XCN’s price has remained within a descending parallel channel that has kept its price in decline since January 25. With strengthening selling activity, the altcoin may stay in this bearish pattern and extend its decline.
If this happens, XCN’s price could plunge to $0.0117.

However, if buying pressure gains momentum, XCN’s price could rally past the $0.0137 resistance of its 20-day EMA and attempt to cross $0.0154.
Disclaimer: The views in this article are from the original Creator and do not represent the views or position of Hawk Insight. The content of the article is for reference, communication and learning only, and does not constitute investment advice. If it involves copyright issues, please contact us for deletion.


