USDJPY Technical Analysis – Is this a breakout or just a fakeout?
. Fundamental Overview . The USD yesterday got a boost across the board following the US CPI report. The data was actually in line with expectations and arguably on the softer side than feared.
FundamentalOverview
The USD yesterday got aboost across the board following the USCPI report. The data was actually in line with expectations and arguably onthe softer side than feared. In fact, the market didn’t really move muchfollowing the release but roughly an hour later we started to see strong bidsin the greenback.
This might have to do withpositioning since the “short US dollar” trade has been the most crowded one andin such instances, it doesn’t take much to see strong unwinding. The market didpare back further the rate cut bets with the pricing now showing 44 bps ofeasing by year end compared to 47 bps before the CPI release. That could still changetoday after the US PPI report.
On the JPY side, we haven’tseen much change in terms of fundamentals as the focus remains on the US-Japantrade negotiations. The BoJ is placing a great deal on trade developments and apositive outcome will likely give the JPY a strong boost as traders would bringforward expectations for a rate hike. The window to watch is between July 20and August 1. On July 20, we have the Japanese upper house elections and August1 is Trump’s deadline for a deal.
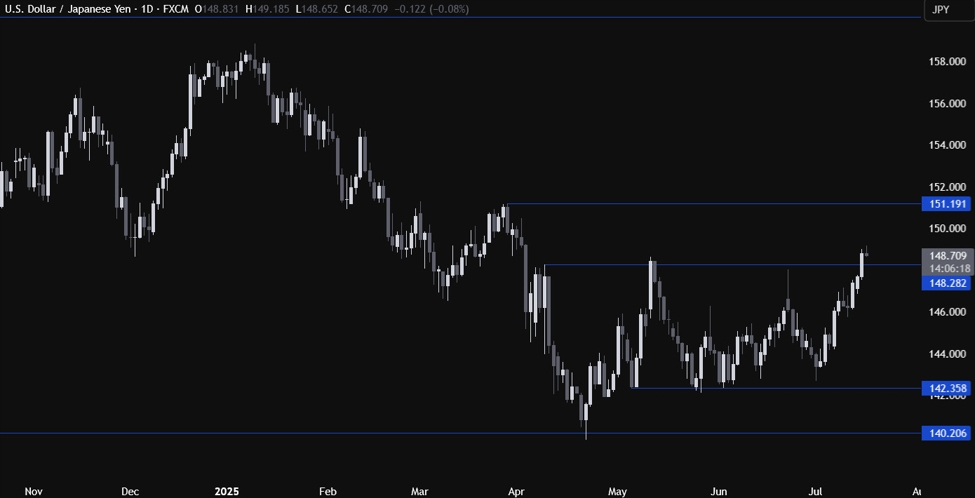
USDJPYTechnical Analysis – Daily Timeframe
On the daily chart, we cansee that USDJPY eventually managed to rally all the way back to the key 148.28 resistance. The price is now trading above theresistance following a strong day for the US dollar yesterday after the US CPI.
If the price falls back belowthe resistance, we can expect the sellers to pile in to position for a dropback into the 142.35 support. The buyers, on the other hand, will keep onstepping in around these levels to keep pushing into the next resistance at151.19.
USDJPY TechnicalAnalysis – 4 hour Timeframe
On the 4 hour chart, we cansee that we have an upward trendline defining the bullish momentum. Froma risk management perspective, the buyers will have a better risk to rewardsetup around the trendline to position for a rally into the 151.19 level next.The sellers, on the other hand, will look for a break below the trendline to increasethe bearish bets into the 142.35 support.
USDJPY TechnicalAnalysis – 1 hour Timeframe
On the 1 hour chart, there’snot much else we can add here as the buyers will look for dip-buyingopportunities around the 148.00 handle and the trendline, while the sellerswill look for downside breakouts to keep pushing into new lows. The red linesdefine the average daily range for today.
UpcomingCatalysts
Today we have the US PPI data. Tomorrow,we get the latest US Jobless Claims and Retail Sales figures. On Friday, weconclude the week with the Japanese CPI and the University of Michigan ConsumerSentiment survey.
Watch the video below
Disclaimer: The views in this article are from the original Creator and do not represent the views or position of Hawk Insight. The content of the article is for reference, communication and learning only, and does not constitute investment advice. If it involves copyright issues, please contact us for deletion.


