S&P 500 Witnesses Largest Post-Trump Rally Since Pandemic and Breaks 200-Day Moving Average
S&P 500 Witnesses Largest Post-Trump Rally Since Pandemic and Breaks 200-Day Moving AverageThe S&P 500 has ignited a striking rally, climbing 17.29% since President Donald Trump declared it’s a “grea
S&P 500 Witnesses Largest Post-Trump Rally Since Pandemic and Breaks 200-Day Moving Average
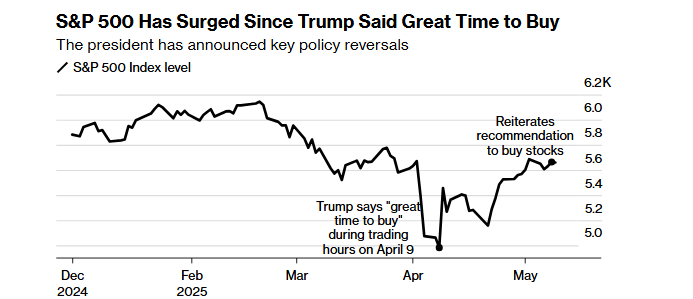
The S&P 500 has ignited a striking rally, climbing 17.29% since President Donald Trump declared it’s a “great time to buy” stocks on April 9, bolstered by a 90-day tariff reprieve that tempered trade concerns.
This surge—the most robust 21-day gain during Trump’s tenure outside of pandemic-driven rebounds—gained momentum as the index decisively cleared its 200-day moving average, a widely watched technical signal of enduring market strength. Yet, beneath this blend of political momentum and technical vigor, investors face the challenge of assessing whether this rally can withstand persistent economic uncertainties.
Trump’s Call Sparks a 17% Surge
On April 9, Trump declared via social media that it was a “great time to buy” stocks, just hours before announcing a 90-day reprieve on some of the harshest tariffs in a century. The S&P 500 responded emphatically, climbing 17% over the next month—the best 21-day rolling performance under Trump’s leadership outside of COVID-era rebounds, according to Bloomberg data. Trump reinforced this sentiment on May 8, telling reporters the economic outlook justified further investment in equities.
This rally came after a sharp 12% drop in the four days leading up to April 8, triggered by fears of a global trade war following Trump’s “liberation day” tariff announcement. The subsequent policy reversal and optimistic rhetoric appeared to restore investor confidence. A senior multi-asset strategist at Pictet Asset Management remarked that, “It’s clear that the Trump put is back in play. But we wouldn’t read too much into it. Ultimately, this is the market pricing in a kind of backstop from the White House.”
The rally gained further momentum on Monday when Washington and Beijing agreed to temporarily slash tariffs, reducing levies on U.S. goods to 10% and on Chinese products to 30%. This news unleashed a 4.2% surge in Nasdaq 100 futures and a 3.3% jump in S&P 500 contracts, with the Dow Jones Industrial Average rising 2.8% and the Nasdaq Composite climbing 4.4% to exit bear-market territory.
A Technical Milestone: Breaking the 200-Day Moving Average
Beyond policy-driven optimism, the S&P 500 achieved a critical technical milestone. On Monday, the index surged 3.3% to close at 5,844.19, surpassing its 200-day moving average of 5,749.44 for the first time in over 30 trading sessions—the longest stretch below this level since 2022, per Dow Jones Market Data. This widely watched indicator is considered a proxy for the market’s long-term trend, and breaking above it signals potential strength.
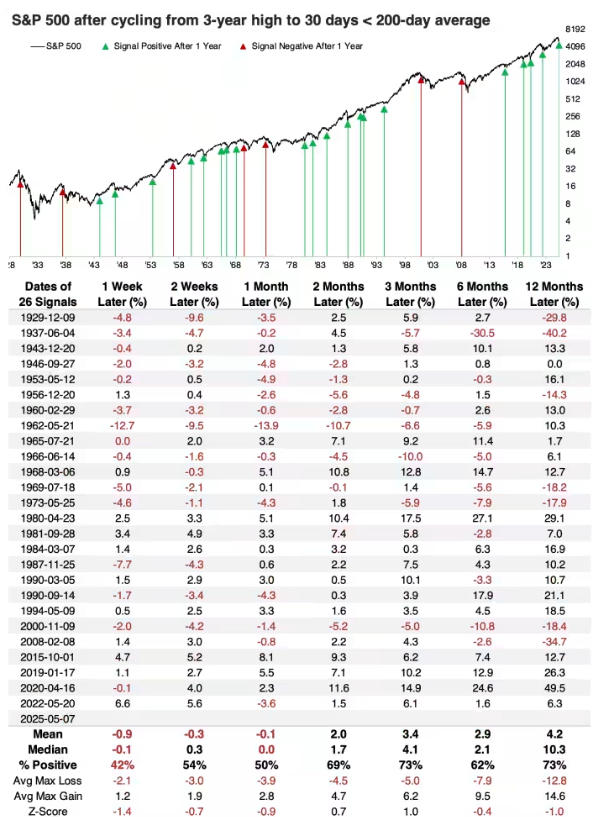
Historical data offers an encouraging perspective. The senior research analyst at SentimenTrader notes that since 1929, when the S&P 500 falls from a three-year high and remains below its 200-day moving average for at least 30 sessions, it typically delivers robust returns thereafter. The median gain is 4.1% over the next three months, with double-digit returns over the following year.
However, the senior research analyst cautions that exceptions exist, such as the significant losses in 2000 and 2008, though he dismisses the notion that a prolonged dip below this level inherently forecasts a bear market, calling it “mostly bunk.”
Relief Rally or Temporary Reprieve?
Monday’s tariff reduction agreement between the U.S. and China sparked a broad market rebound, often termed a “relief rally.”
Yet, questions linger about its durability. The chief market strategist at Ritholtz Wealth Management still advises investors to monitor the S&P 500’s 200-day moving average as a litmus test for whether these gains will hold. “In past recoveries, the 200-day was the line in the sand between a mood-driven rally and a durable climb to new highs,” the market strategist said.
Beyond that, the market strategist also highlights a key risk: recessions often trigger prolonged selloffs driven by declining corporate profits and income losses—a scenario that, while not imminent, remains plausible. Investors must weigh this against the current optimism stemming from eased trade tensions.
What Lies Ahead
The S&P 500’s recent performance reflects a potent mix of political influence, technical strength, and economic relief. Trump’s comments and the U.S.-China trade deal have provided a near-term boost, while the break above the 200-day moving average offers technical reassurance. However, sustainability remains uncertain amid potential economic headwinds.
Investors should keep a close eye on the index’s behavior around this key technical level and stay attuned to trade policy developments. While the rally is a positive signal, caution is warranted as the market navigates this volatile landscape.
In summary, the S&P 500’s surge underscores the interplay of sentiment, policy, and technicals. Whether this marks the start of a sustained uptrend or a fleeting bounce will depend on the weeks ahead.
Disclaimer: The views in this article are from the original Creator and do not represent the views or position of Hawk Insight. The content of the article is for reference, communication and learning only, and does not constitute investment advice. If it involves copyright issues, please contact us for deletion.


