黄金技术分析 - NFP 报告增加了看涨情绪
基本概述.上周五 , 在美国 NFP 报告发布后 , 黄金飙升至上行.数据显示 , 随着失业率的上升和下降 , 劳动力市场出现了更多降温。.
FundamentalOverview
Last Friday, gold spiked to the upside following the USNFP report. The data showed some more labour market cooling with anincrease in the unemployment rate and a decrease in wage growth. That made thereal yields to drop and gold to accelerate to the upside. This has been thecase for a couple of years now where a rise in real yields sees a much smallerfall in gold compared to a fall in real yields which triggers a bigger rally ingold.
As of now, it looks like gold have limited downside but lots of upside asinflation abates slowly while risks to the growth picture increase the longerthe Fed keeps policy restrictive. In the short-term, strong US data might weigha bit on the market, but in the long-term weak data is likely to trigger biggerupside moves.
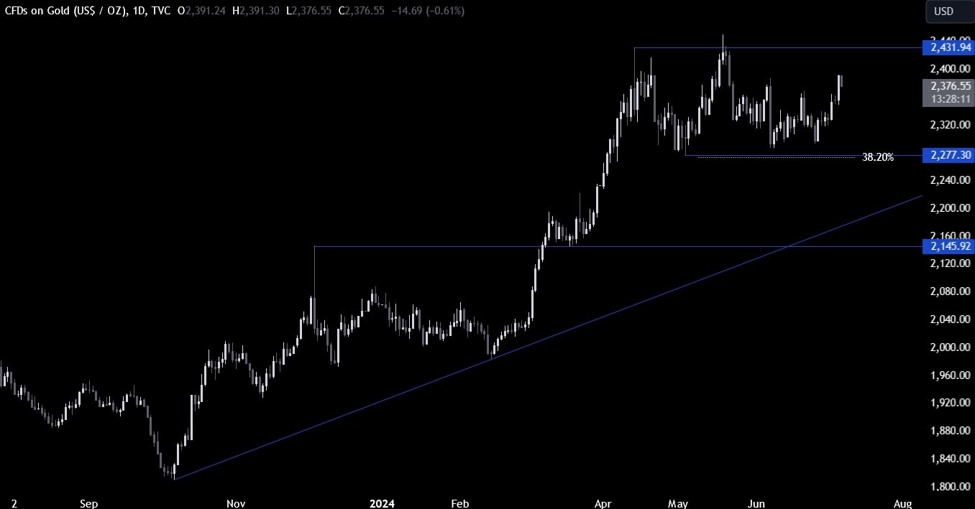
GoldTechnical Analysis – Daily Timeframe
On the daily chart, we cansee that gold has been on a steady rise since bottoming out near the key 2277 support as the buyers piled in around the bottom ofthe range and are now looking towards the cycle high around the 2430 level. Ifthe price gets there, we can expect the sellers to step in around the top ofthe range to position for a drop back into the 2277 support targeting a breakbelow it.
Gold Technical Analysis– 4 hour Timeframe
On the 4 hour chart, we cansee that the price rallied into the 2387 resistance following the soft US NFPreport and started to pull back. We now have a good support zone around the2368 level where we can also find the confluenceof the previous swing high, the minor trendlineand the 61.8% Fibonacciretracement level.
This is where we can expectthe buyers to step in with a defined risk below the trendline to position for abreak above the 2387 resistance. The sellers, on the other hand, will want tosee the price breaking below the trendline to increase the bearish bets intothe 2277 support.
Gold Technical Analysis– 1 hour Timeframe
On the 1 hour chart, we cansee more clearly the recent price action and the bullish setup around the 2368level. We can also notice that we have the lower limit of the average daily range for today right around the support,so that should give the buyers a bit more confidence to pile in around the 2370level looking for a continuation of the uptrend.
UpcomingCatalysts
This week is a bit bare on the data front but nonetheless we will have some keyeconomic releases. Tomorrow, we have Fed Chair Powell testifying to Congressand the markets will be focused on any view or hint about the monetary policytrajectory after the recent NFP report. Thursday will be the most important dayof the week as we get the US CPI and the US Jobless Claims figures. Finally, onFriday, we conclude the week with the US PPI and the University of MichiganConsumer Sentiment survey.
See the video below
Disclaimer: The views in this article are from the original Creator and do not represent the views or position of Hawk Insight. The content of the article is for reference, communication and learning only, and does not constitute investment advice. If it involves copyright issues, please contact us for deletion.


