USDCAD バイヤーは今日、 2024 年に戻る新しい安値に達した後、反撃します。
4 時間チャートの USDCAD テクニカル USDCAD は本日早朝の下方圧力を続き、 1 の間の主要なスイングエリアを下回りました。
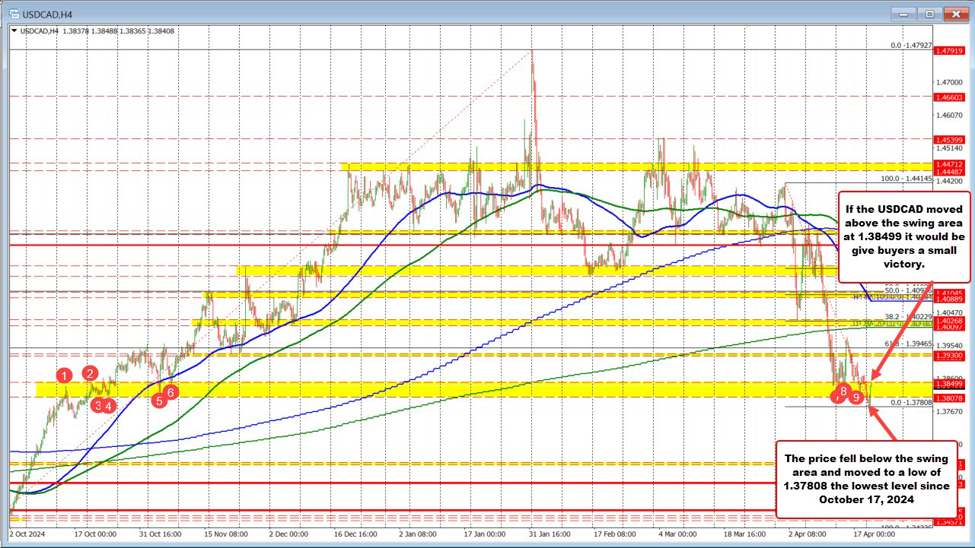
The USDCAD continued its downward pressure earlier today, breaking 1.38078 と 1.38499 の間の主要なスイングエリアの下. This zone has been significant, acting as support and resistance going back to 2024 年 10 月 ~ 11 月, and again over the past two weeks.
The break took the pair to a new low at 1.37808, marking the 2024 年 10 月 17 日以来の最低水準. However, that downside extension 蒸気がなくなった, and the pair has since rebounded, climbing スイングゾーンに戻ります.
The near-term battle now centers on whether buyers can push the price 1.38499 のスイングエリアの上限を超えて. A move above that level would represent a バイヤーの小さな勝利, but additional hurdles lie ahead.
最終的に破られる必要がある次の上方目標には、次のものが含まれます。
100-1.38692 の 1 時間移動平均 ( 下のチャートの青い線を参照 ) – A break above would add to short-term bullish momentum.
200-1 時間移動平均 1.39122 (green line on the chart below)– Clearing this level would be a more convincing shift in bias toward the upside.
As it stands, バイアスは下方に傾き続けます, but buyers are trying to make a stand. Watch 1.38499 closely—下位にとどまり売り手はコントロールし続けます; break above, and the recovery effort gains traction.
免責事項: この記事の見解は元の著者の見解であり、Hawk Insight の見解や立場を表すものではありません。記事の内容は参考、コミュニケーション、学習のみを目的としており、投資アドバイスを構成するものではありません。著作権上問題がある場合は削除のご連絡をお願い致します。


